
Cape Town dams surge by nearly 20% in a week
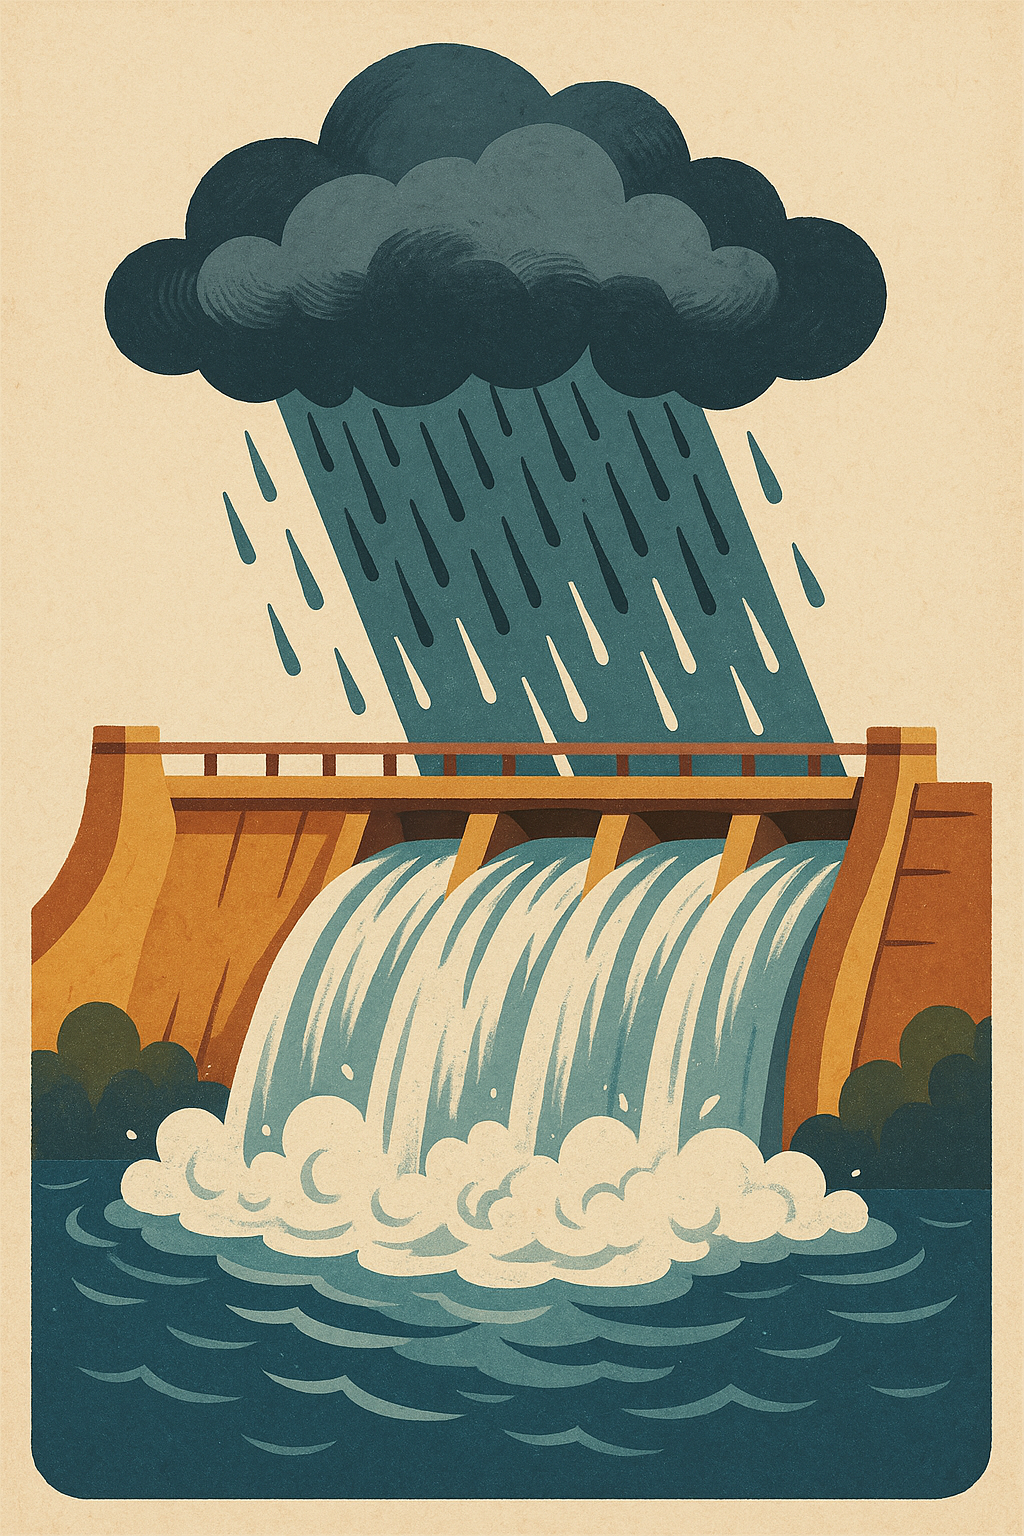
Cape Town's dams jump to 70% after record-breaking rain. Learn how the city is banking water and managing agricultural and urban impacts.
Cape Town just got hit by an insane amount of rain, like a a 200-year flood! It poured so much that the dams, which were almost empty, are now super full, over 70%. This means the city has tons of water again. But all that rain also caused some floods and problems for farmers. Still, it's a huge relief after worrying about running out of water.
How much rain did Cape Town receive during the recent downpour?
Cape Town experienced a "biblical cloudburst" between May 30 and June 7, with a remote gauge tallying 457 mm in three days. This amount normally represents the entire May-to-October quota for the region, leading to a significant surge in reservoir levels.
Get Cape Town news in your inbox
Stay updated with the latest stories from the Mother City.
A Biblical Cloudburst That Shattered Every Yardstick
Between sunset on 30 May and the small hours of 7 June, a parade of frigid fronts clung to Africa’s south-western corner long enough to empty the equivalent of a million swimming pools onto the Western Cape’s folded spine. A remote gauge on the Franschhoek buttress tallied 457 mm in three days - normally the ridge’s entire May-to-October quota. Two automated stations at the headwaters of the Berg declared the return interval “above two centuries,” while Jonkershoek’s 1920s rain canister overflowed at 300 mm before officers could reach it.
SAWS slapped a Category 5 on its Extreme Rainfall Index, a label usually reserved for tropical tempests. EUMETSAT’s infrared eye caught cloud tops colder than –70 °C for twenty straight hours, a violence normally seen only over the warm Agulhas Current. Meteorologists trace the anomaly to a rare triple-lane pile-up: a looping polar jet, a cut-off low that deepened like a black hole offshore, and a plume of balmy, moisture-laden air that the Cape Fold Belt rammed skyward. What formed was a near-motionless convergence band that squeezed every droplet aloft for two full days.
Dams: From Amber Warning to Verdant Relief in One Week
On 23 May - barely a fortnight earlier - Western Cape Water Supply System (WCWSS) storage had slipped below 52 %, nudging the city into the same “early drought caution” last seen after the 2018 Day Zero scare. By 6 June the dial read 70.8 %, an 18.9-point leap that crammed 384 million cubic metres into the six mega-dams - enough to supply Gauteng’s Lesotho pipeline for a full year.
Theewaterskloof, the 480-billion-litre workhorse, leapt from 44 % to 66 % - its steepest seven-day climb since records began in 1985. Voelvlei swallowed 22 m.c.m.; Berg River Dam, the youngest and smallest of the giants, filled so fast that abstraction halted to avoid overtopping. Even the twin Steenbras tubs crept to the brim, letting the city idle its expensive desal plants and throttle back on aquifer pumps that had been labouring at 55 % since January.
How Engineers Rode the Rising Rivers
Cape Town’s water war-room pings 378 telemetered sites every quarter-hour. At the peak, Berg River at Goudini spiked above 2 400 m³/s, forcing operators to crack Misverstand Dam’s radial gates at 03:30 on 5 June to spare the wall. Because the dam irrigates downstream citrus and vine farms, the midnight release triggered an immediate curtailment notice - proof that drought reflexes still steer the control room even when rivers rage.
At the same moment, the city issued a grey-water advisory for low-lying Plattekloof and Edgemead after storm drains gagged on the torrent. Every move is choreographed on HydroNET, a CSIR-built platform that blends radar now-casts with machine-learning inflow guesses. By 9 June the model showed a rainfall-runoff efficiency of 38 % - almost unheard-of in sandstone fynbos soils where water usually vanishes into deep fractures.
Orchards, Vineyards and the Shock of Too Much
The same mountains that refill the dams also underpin a R50-billion fruit-and-wine belt. Three weeks ago, agriculture officials feared 2025 apple and pear exports could plummet 23 % under continued restrictions. The reversal, while miraculous, bred a fresh headache: orchards stand ankle-deep, so growers hired helicopters to rain copper oxychloride against black-spot blight.
In Breedekloof one cellar logged 311 mm in twenty-four hours, flooding barrel halls and forcing two estates to forklift entire vintages to higher ground. On the bright side, on-farm irrigation dams shot from 38 % to 92 %, scrapping any thought of cuts until at least 2026. Agronomists reckon nutrient flushing in upper soils could swell table-grape berries by 5–7 %, adding a potential R800-million to export tills.
Banking Today’s Surplus for Tomorrow’s Drought
Augmentation schemes rolled out after 2018 - desal skids at Monwabisi and Strandfontein, the Atlantis and Cape Flats aquifer recharge pads, and the Zandvliet reuse works - had been costing the city R7.4 per kilolitre against R1.4 for gravity dams. With reservoirs brimming, the temporary desal plants are off-line, but their high-pressure pumps now ram 45 million litres a day into the Cape Flats Aquifer - winter water stashed for a sun-baked year ahead.
The method copies Orange County, California: spreading basins let clean stormwater percolate through sandy lenses into a clay-capped store. Tracer studies using oxygen-18 say today’s injections will resurface in 190–270 days, just in time for the 2025 summer surge in demand.
City Streets, Canals and the Hidden Floods
Beyond the big dams, 1 450 km of 1970s-era culverts and canals groaned under a 1:100-year load, spawning 84 localised floods and nine Table Mountain mudslides. Green Point Urban Park turned into a temporary lake; its engineered swales choked yet still barred 3.5 million litres of polluted runoff from the Atlantic.
UCT loggers show stormwater ponds at Newlands and Black River harvested enough to irrigate 65 % of the city’s winter park plantings. Lab tests prove faecal counts dropped to irrigation-safe levels after forty-eight hours, underscoring how dual-use landscapes can both blunt floods and green the city.
Smart Meters Catch the Rebound
Citywide smart meters ping hourly via LoRaWAN radio. Between 27 May and 3 June daily demand crept from 825 MLD to 871 MLD, nudging past the 860 MLD winter target. Two-thirds of the jump came from leafier suburbs - Newlands, Rondebosuch, Claremont - where residents reactivated garden sprinklers the moment dams looked healthy. Officials will not yet impose fines, but a targeted SMS blitz will nudge households with social-norm nuggets (“You used 15 % more than your water-wise street average”). UCT behavioural economists think gentle peer pressure could claw back 30–40 MLD.
Ripple Effects Far Beyond the City
The same storm soaked the Gouritz catchment, pushing Stompdrift and Kammanassie in the Little Karoo past 90 %. Farmers who stockpiled drought fodder now battle lush paddocks and a surge in liver-fluke among sheep, the inevitable fallout of vlei systems that doubled as snail nurseries. At Clanwilliam Dam - historically isolated from Cape Town’s network - authorities advanced a spillway upgrade to shed the excess, hinting at a future Brandvlei–Cape Town pipeline still on the drawing board.
Climate Models Say Get Used to the Extremes
CSIR coupled models suggest winter precipitation over the south-western Cape could rise 10–15 % by 2090 - but delivered in rarer, meaner bursts. Palaeo-drip data from Cederberg caves already record similar swings during the Little Ice Age: multi-decadal dry spells punctuated by brief, torrential pluvials. Meanwhile the Agulhas Current runs 1.4 °C warmer than the 1981-2010 mean, boosting atmospheric rivers that, a Nature Climate Change paper warns, could spike by a fifth before mid-century - each packing 100- to 200-year rainfall totals inside a single weekend.
Citizen Cameras and the Science Pay-off
Within days the WeatherSA portal harvested 8 000 crowd-sourced photos. Machine-learning sift revealed 1 200 fresh erosion gullies in shack settlements - data the city can weave into hazard maps. High-school learners collected rain samples across 42 sites; isotope fingerprints will sharpen future flood forecasts, proving grassroots science can turbo-charge institutional hydrology.
What the Next Three Months Hold
The European Centre pegs a 60 % chance of above-normal rain through August, possibly nudging dam levels past 85 % for the first time since 2014. That would trigger ecological pulse releases down the Berg and Breede estuaries - last done in 2013. Atlantis aquifer recharge will continue at double the usual clip, banking 9 m.c.m. more before summer. Desal skids will stay on hot-standby, able to spin up 150 MLD within three days if 2025 turns dry. Every smart-metered home will receive a personalised “halfway report” by July, translating today’s habits into year-end bills under both drought and non-drought tariffs - an early nudge while savings are still painless.
And beneath the headlines, NASA’s gravity satellites show an extra 97 m.c.m. now stored in soils, backyard aquifers and minor farm dams - an invisible reservoir that should shave 12 % off garden irrigation demand come spring, quietly stretching every drop long after the storm has passed.
[{"question": "What caused the recent extreme rainfall in Cape Town?", "answer": "The extreme rainfall, described as a \"biblical cloudburst,\" was caused by a rare triple-lane meteorological event: a looping polar jet, a cut-off low-pressure system that deepened offshore, and a plume of warm, moisture-laden air that was forced upwards by the Cape Fold Belt. This created a near-motionless convergence band that squeezed out immense amounts of rain for two full days, leading to what some automated stations declared a \"two-century return interval\" event."},
{"question": "How much did Cape Town's dam levels increase after the downpour?", "answer": "Cape Town's Western Cape Water Supply System (WCWSS) storage surged dramatically. On May 23rd, dam levels were below 52%, but by June 6th, they had jumped to 70.8%. This 18.9-point increase added 384 million cubic metres of water to the six mega-dams, an amount equivalent to a year's supply for Gauteng's Lesotho pipeline. Theewaterskloof, the largest dam, rose from 44% to 66% in just seven days."},
{"question": "What impact did the intense rain have on agriculture in the region?", "answer": "While the rain refilled on-farm irrigation dams from 38% to 92%, alleviating drought fears for at least until 2026, it also created new challenges. Orchards were left ankle-deep in water, requiring farmers to use helicopters to spray copper oxychloride to prevent black-spot blight. Some vineyards experienced flooding, forcing estates to move vintages to higher ground. However, agronomists predict that nutrient flushing in upper soils could lead to a 5-7% increase in table-grape berry size, potentially adding R800 million to export revenues."},
{"question": "How is Cape Town managing its water resources with the increased dam levels?", "answer": "With reservoirs brimming, the city has idled its expensive temporary desalination plants and reduced reliance on aquifer pumps. Instead, the high-pressure pumps from the desal plants are now being used to inject 45 million litres of water daily into the Cape Flats Aquifer. This method, similar to practices in Orange County, California, stores winter water underground for use during the dry summer months. Tracer studies indicate this injected water will resurface in 190-270 days, just in time for the 2025 summer demand."},
{"question": "Were there any negative consequences or damage from the heavy rainfall?", "answer": "Yes, despite the water relief, the extreme rainfall led to several negative consequences. The 1970s-era culverts and canals groaned under the load, resulting in 84 localised floods and nine mudslides on Table Mountain. Green Point Urban Park turned into a temporary lake, and storm drains in low-lying areas like Plattekloof and Edgemead were overwhelmed. Farmers also faced issues like waterlogged orchards and a surge in liver-fluke among sheep due to lush pastures and snail-infested wetlands."},n{"question": "What are the future predictions for rainfall and water management in Cape Town?", "answer": "Climate models suggest that winter precipitation in the south-western Cape could increase by 10-15% by 2090, but it will likely come in rarer, more intense bursts. The European Centre predicts a 60% chance of above-normal rain through August, potentially pushing dam levels past 85% for the first time since 2014. Cape Town plans to continue its aquifer recharge efforts, banking an additional 9 million cubic metres before summer. Desalination plants will remain on standby, capable of producing 150 MLD within three days if needed for a dry 2025. Smart meters will also be used to send personalized \"halfway reports\" to residents, encouraging water-wise behaviour."}]

Sizwe Dlamini is a Cape Town-based journalist who chronicles the city’s evolving food scene, from boeka picnics in the Bo-Kaap to seafood braais in Khayelitsha. Raised on the slopes of Table Mountain, he still starts every morning with a walk to the kramat in Constantia before heading out to discover whose grandmother is dishing up the best smoorsnoek that day.
View all articles →