
One dead in Garden Route flooding as Western Cape issues warning
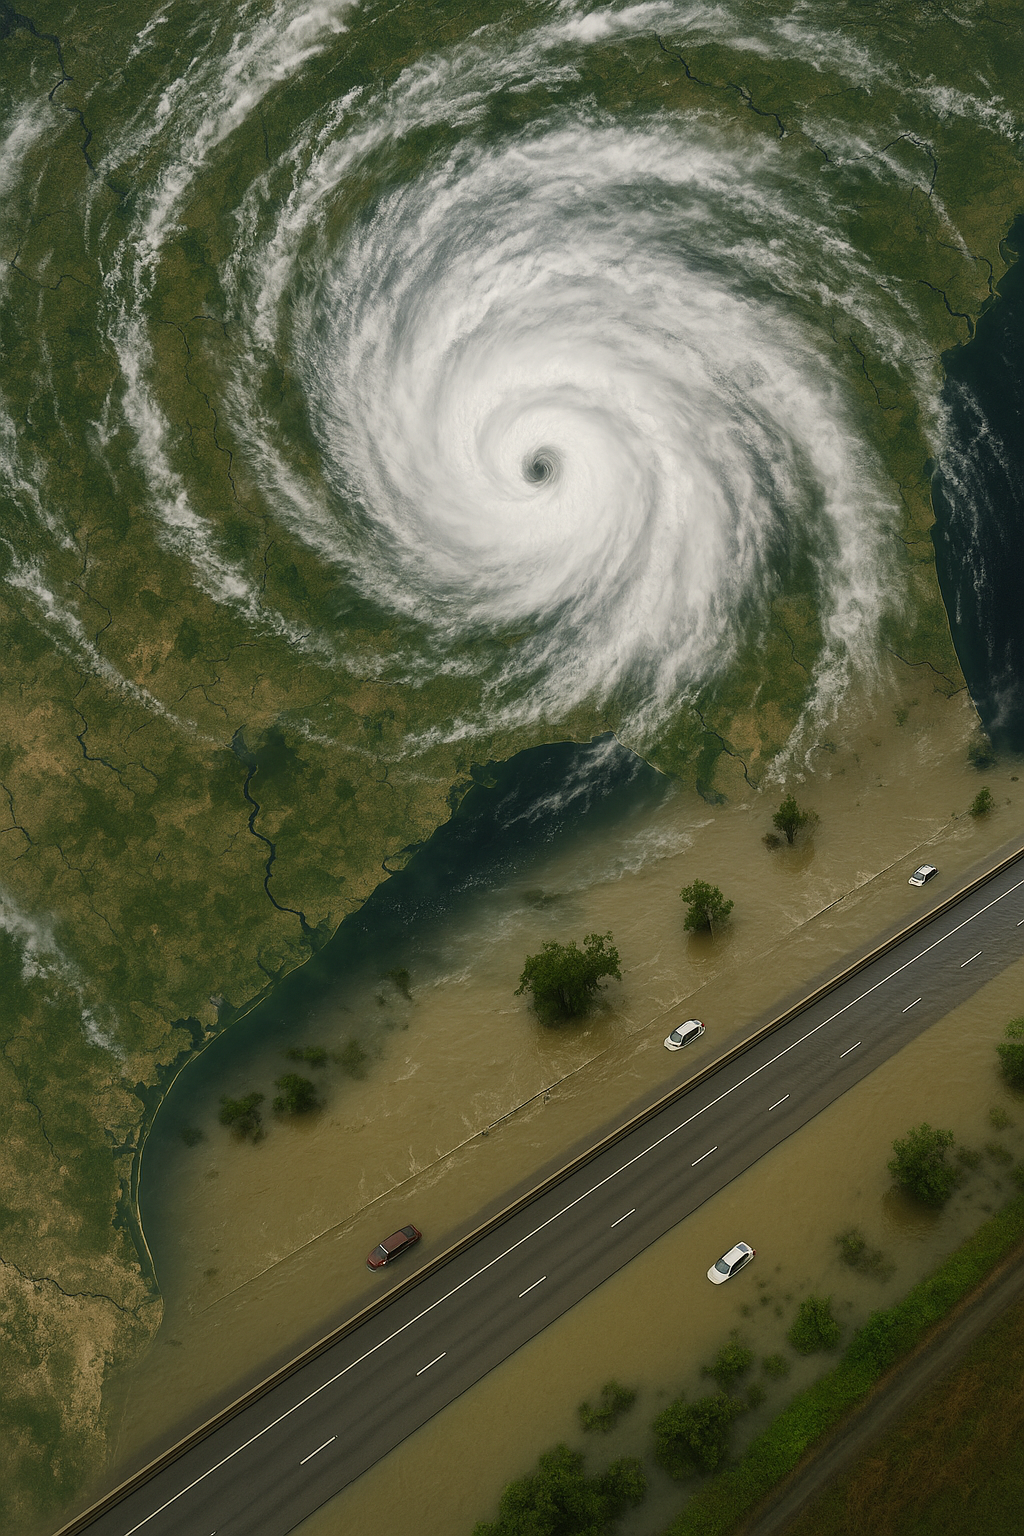
Explore the multi-layered Western Cape flood crisis, from its meteorological origins to hydrological overdrive, dam operations, and community resilience.
A tricky weather system, called a "cut-off low," mixed cold air and warm ocean moisture, creating powerful, unmoving thunderclouds over the Western Cape. Then, strong winds made the rain even heavier, with huge raindrops falling super fast. This caused big floods, making rivers rush like trains and even reversing their flow. Dams had to open their gates wide to let out all the water, causing one sad death. People were evacuated quickly with new technology, and even TikTok was used to help spread safety messages.
What caused the severe flooding in the Western Cape?
The severe flooding in the Western Cape was primarily caused by a "cut-off low" weather system that mutated into a long-duration, high-rainfall event. This system combined cold polar air with moisture from the Agulhas Current, creating a stationary band of thunderclouds. Additionally, a jet of south-easterly wind amplified rainfall through the production of oversized "warm rain" globules.
Get Cape Town news in your inbox
Stay updated with the latest stories from the Mother City.
How a Cut-Off Low Became a Rainfall Monster
On the morning of 11 June 2024, satellite loops captured a lonely swirl of cloud more than 1 000 km south of Cape Agulhas. Meteorologists labelled it a cut-off low - normally a fleeting nuisance. Over the next forty-eight hours, however, the system mutated into a hybrid beast: it tapped the chill of polar air while siphoning latent heat from the Agulhas Current. The result was a motionless conveyor belt of thunderclouds; the Outeniqua peaks measured 320 mm before the bands finally unravelled. That total dwarfs George’s long-term June mean by a factor of three and sets a new record since automatic weather stations arrived in 1995.
While forecasters watched the low, another mechanism slipped under the radar. A jet of south-easterly wind barrelled through the coastal notch between Knysna and Plettenberg Bay before cannoning into the Tsitsikamma ramparts. The abrupt upslope forced cloud droplets to merge into oversized “warm rain” globules - 5 to 7 mm across - that struck the ground faster than 9 m/s. With infiltration reduced to zero, runoff became instant sheet flow; stream gauges doubled in under six hours.
The storm’s odd behaviour has prompted the South African Weather Service to re-examine its thresholds for cut-off lows along the south coast. Current criteria assume mobility after 24 hours; this system parked for two days and amplified the deluge.
When Rivers Behaved Like Freight Trains
Hydrologists watching the Gourits above the dam saw the inflow spike to 2 800 m³/s late on 13 June, a return interval close to twenty years. Operators lifted every gate to the stops, letting 1 900 m³/s race downstream. Picture an Olympic pool vanishing in 1.2 seconds; that was the scale of the torrent. Out on the Leeu Gamka plain the water fanned out, overtopping the N1 where grout had once anchored guardrails. Drivers met a moving wall of water 60 cm deep that chewed asphalt into craters large enough to swallow a wheel.
Further east the normally sleepy Touws River staged its own surprise. A delayed pulse, arriving 36 hours after the first crest, rode backwater from the Gourits and briefly reversed the Touws at its confluence. The oddity robbed residents of the usual “safe window” when water levels taper off; instead, the second wave kept fields saturated for an extra day and a half.
Downstream gauges recorded dissolved oxygen plunging near the estuary as organic debris began to rot. Fisheries scientists warn that the blackwater plume may linger for weeks, threatening juvenile estuarine fish that rely on fresher, more saline conditions.
Dams at the Edge: Codes, Calculations and a Single Life Lost
Garden Route, Stompdrift and Kammanassie dams - all above 110 % - opened their spillways in unison. Operators followed the colour-coded playbook drafted after Laingsburg’s 2006 catastrophe. Red-mode logic treats human life as non-negotiable; gates swing wide even if orchards or informal houses drown. On 15 June drone footage traced the Garden Route Dam’s chocolate-brown jet for four kilometres, a drifting logjam of branches and plastic trash in tow.
Radial gates on each dam beam live data to Bellville’s Provincial Disaster Centre every 900 seconds. A machine-learning model stirs soil-moisture probes, X-band rainfall radar and even stalled-vehicle geotags into a single dashboard. The algorithm recalculates gate settings four times an hour, yet nothing in the code foresaw the lone fatality: at 04:15 a 34-year-old welder from De Rust attempted to ford the Doring River, now knee-deep only in memory. With a new moon cloaking the water, he misjudged depth and was swept away.
Engineers argue the tragedy underscores the need for AI to factor lunar illumination and pedestrian risk perception. A software patch now flags crossings after 02:00 on dark-moon nights, triggering push alerts to the district WhatsApp channel.
Evacuation in Real Time: Tech, Tents and TikTok
The first evacuation order pinged phones at 03:27 on 13 June. By 17:30 that afternoon 93 residents of De Rust and Welgeluk had reached Toekomsrus Hall, ferried over a 12 km muddy detour by a convoy of bakkies. The hall’s floor plan looks like a pop-up city: camp-cots stand 2 m from walls for wheelchair access, a curtained “quiet zone” shelters autistic children, and a pop-up pharmacy holds 48 hours of chronic meds under a 2023 Dischem memorandum.
Power hummed from two 30 kVA inverter trailers the province hired last October under a “green resilience” pilot. Each rig pairs rooftop panels with lithium-phosphate batteries, keeping Wi-Fi alive so evacuees could file UIF claims or join virtual classrooms. Within forty-five minutes volunteers had swung a Starlink dish onto the roof - proof that low-orbit broadband has slipped from novelty to crisis staple.
While residents slept on camp-cots, disaster psych-teams circulated a TikTok clip showing a calm 30 cm-deep current bowling over an adult. Geo-fenced to flood-prone zones, the 15-second reel logged 67 000 views and a 12 % click-through to real-time depth gauges. Behavioural scientists dub the campaign a digital sandbag for the mind.
What caused the severe flooding in the Western Cape?
The severe flooding in the Western Cape was primarily caused by a "cut-off low" weather system that combined cold polar air with warm ocean moisture from the Agulhas Current. This created a powerful, unmoving band of thunderclouds. Additionally, strong south-easterly winds amplified the rainfall by forcing cloud droplets to merge into oversized "warm rain" globules, leading to exceptionally heavy and fast-falling rain.
How did the rivers in the Western Cape react to the deluge?
The rivers in the Western Cape experienced unprecedented behavior. The Gourits River saw its inflow spike dramatically, necessitating the full opening of dam gates to release 1,900 m³/s of water downstream. This created a torrent capable of overtopping roads and causing significant damage. Unusually, the Touws River even reversed its flow temporarily due to backwater from the Gourits, prolonging saturation in affected areas and leading to concerns about declining dissolved oxygen levels in estuaries, which could impact fish populations.
What measures were taken regarding dams during the flood, and what was an unexpected consequence?
Dams like Garden Route, Stompdrift, and Kammanassie were operating above 110% capacity and opened their spillways in unison, following established emergency protocols that prioritize human life. While real-time data and machine-learning models were used to recalculate gate settings frequently, the system did not foresee a lone fatality. A 34-year-old welder was swept away while attempting to cross the Doring River at night during a new moon, misjudging its depth due to poor visibility. This incident highlighted the need for AI to incorporate factors like lunar illumination and pedestrian risk perception.
How was technology utilized for evacuation and communication during the disaster?
New technology played a crucial role in evacuation efforts. The first evacuation orders were sent to phones early in the morning, leading to the swift relocation of residents. Pop-up facilities, complete with wheelchair access, quiet zones for autistic children, and temporary pharmacies, were set up in evacuation halls. Power was maintained by inverter trailers with solar panels and lithium batteries, ensuring Wi-Fi connectivity. Furthermore, Starlink dishes provided crucial broadband access. Social media platforms like TikTok were also leveraged, with geo-fenced clips demonstrating the danger of even shallow currents to encourage caution and direct users to real-time depth gauges.
What is a "cut-off low" and how did this one differ from typical systems?
A "cut-off low" is a weather system typically characterized by a swirl of cold air that detaches from the main westerly air currents. While usually fleeting, the one affecting the Western Cape was unique because it mutated into a

Lerato Mokena is a Cape Town-based journalist who covers the city’s vibrant arts and culture scene with a focus on emerging voices from Khayelitsha to the Bo-Kaap. Born and raised at the foot of Table Mountain, she brings an insider’s eye to how creativity shapes—and is shaped by—South Africa’s complex social landscape. When she’s not chasing stories, Lerato can be found surfing Muizenberg’s gentle waves or debating politics over rooibos in her grandmother’s Gugulethu kitchen.
View all articles →