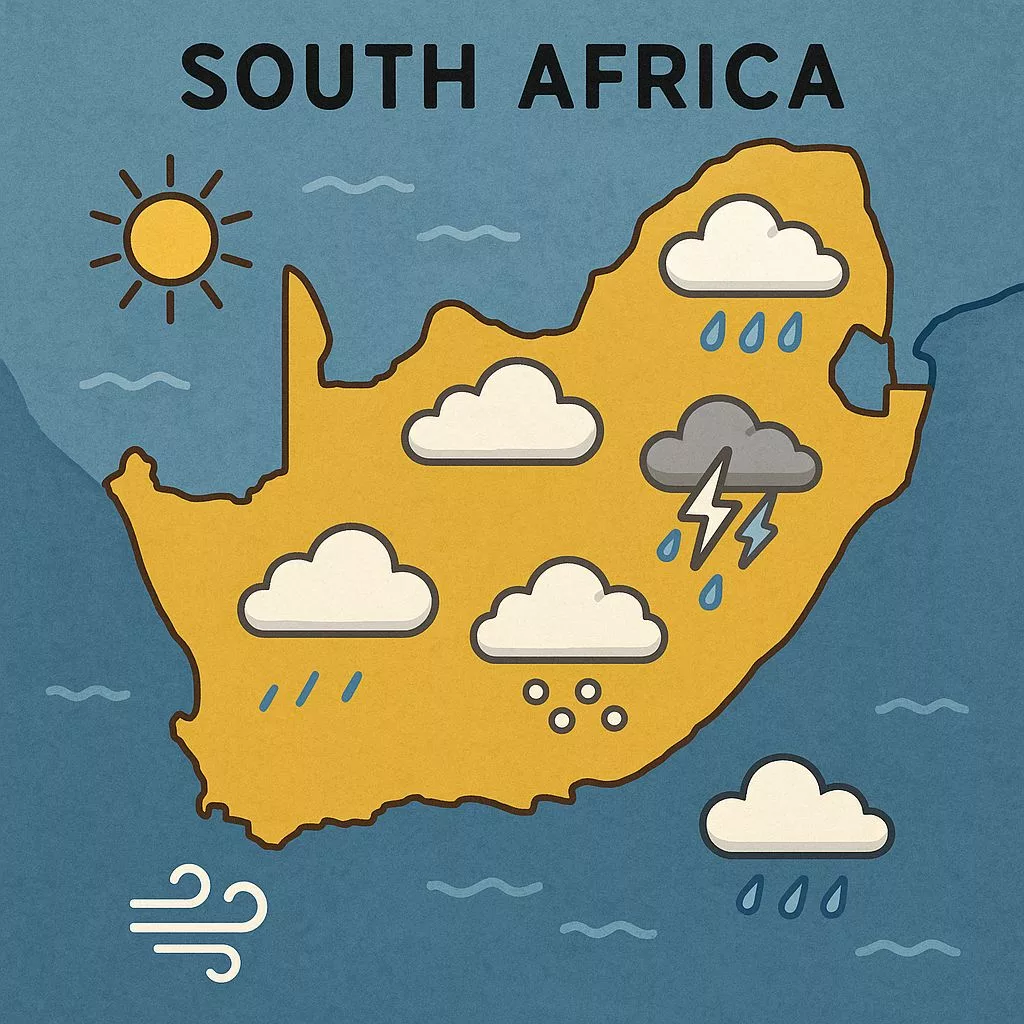
South Africa is experiencing a Level-2 yellow thunderstorm alert. This means moderate disruptions are expected due to strong storms with frequent lightning, heavy rain, and damaging hail. Four different air masses colliding create a dynamic weather pattern across the country, leading to diverse conditions from hot, dry areas to cool, misty zones. From the lightning-prone Highveld to the storm-squeezing escarpments and coastal microclimates, understanding these weather warnings is crucial for safety and planning. This intense weather is further impacted by climate change, making accurate data and public awareness more important than ever.
What is a Level-2 yellow thunderstorm alert in South Africa?
A Level-2 yellow thunderstorm alert from the South African Weather Service (SAWS) signifies a moderate chance of noticeable disruption due to severe weather. This includes frequent lightning, downpours of up to 30 mm/hour, large hail capable of denting, and runoff sufficient to overwhelm drains. Emergency services escalate preparations, and public awareness is crucial as outdoor activities may be cancelled and insurance excesses for hail claims can double.
South Africa’s heavens never rest.
On an ordinary January day the sub-continent balances four rival atmospheres: warm, sponge-like streams from the Mozambique Channel; chilled polar maritime billows that surf 4 000 km across the Southern Ocean; sun-baked subsiding air anchored by the Kalahari High; and searing berg-wind currents that cascade down the Great Escarpment. The outcome is a meteorological patchwork so fine that a two-hour road trip can swing you from a 43 °C dust-oven to a 14 °C mist-cooled drizzle zone. Right now that patchwork is commanded by a single noisy guest: a mid-level trough gliding east at 28 km/h, lobbing waves of unstable air that have nudged the South African Weather Service to raise a Level-2 yellow thunderstorm alert.
Decoding the Yellow Thunderstorm Flag
SAWS speaks through a four-tier, colour-graded impact system.
Yellow (Level 2) is bureaucratic shorthand for “moderate chance of noticeable disruption.” In storm-speak that translates to: lightning stabbing somewhere inside the warning polygon every half-minute, downpours capable of 30 mm in 60 minutes, hailstones hefty enough to punch dents, and enough runoff to defeat drains built for a 1-in-5-year flood. Emergency crews switch from “monitor” to “prepare” mode – sandbags appear on corners, ambulances top up tanks, Eskom orders linesmen off non-urgent pole work.
The public, however, often confuses yellow with “just be vaguely careful.” In reality it is the tipping point where outdoor sports tournaments get cancelled, insurance excesses double for hail claims, and suburban WhatsApp groups light up with pictures of puddles. Understanding this threshold can save an afternoon, a windscreen, or even a life.
Gauteng: Lightning Laboratory on the Highveld
The Highveld’s elevation – 1 400 m to 1 700 m – thins the air by roughly 15 %, letting ice crystals loiter at –40 °C for longer. More frozen particles bump, grind and separate electrical charge, so Gauteng crackles at 20–30 cloud-to-ground flashes per km² each year, a global hot-spot. Present-day CAPE values flirt with 2 000 J kg⁻¹, sufficient to levitate 4 cm hail. Stir in 25 kt of vertical wind shear and the sky cooks “splitting supercells”: the right-mover tracking toward Boksburg, the left-mover spinning at Randfontein. Commuters who must travel should keep 702 AM on – storm spotters phone live hail reports straight to the traffic helicopter.
Yet lightning density is only half the story. Urban heat islands add an extra 200 J kg⁻¹ of CAPE over central Johannesburg, essentially turning the city into a 1 600 m-high anvil furnace. Add the 30 000-plus metallic rooftops acting as perfect grounding points and you understand why suburban surge-protector sales spike every summer. If you can work from home today, do; your laptop will thank you.
Mpumalanga: Where the Escarpment Squeezes Clouds into Storms
The Lebombo and Drakensberg ramparts climb 1 000 m inside 25 km, a wall that bullies moist low-level air upward at 1–2 m s⁻¹. By 10 am the first cumulonimbus already throws a purple shadow over Barberton. SAWS keeps a “shallow fog” rider in the bulletin because dew-points of 19–20 °C cool overnight and saturate the valley floors. The fog layer is thin – 30–50 m – so helicopter pilots can legally lift once they climb through 200 ft. By lunch thermals have shredded the mist, but new towers explode, drinking from a boundary layer 1.8 km deep.
For farmers the timing is money. Macadamia and avocado orchards occupy the same narrow frost-free band where morning fog lingers. A misty dawn keeps skin temperatures below 25 °C, reducing sun-scorch risk, but it also delays spraying. Pilots must choose: wait for clearer skies and risk fungal outbreak, or fly in marginal visibility and gamble on insurance. Most split the difference, lifting off just as the fog frays into dancing wisps – one eye on the thermometer, the other on the gathering cumulus.
Limpopo: Lowveld Furnace and the Soutpansberg Surprise
North of the Strydom Tunnel the plateau drops to 300 m, a brick-oven where thermometers kiss 38 °C before noon. A capping inversion parked at 750 hPa is forecast to smother deep convection, so the warning polygon politely skirts this oven. Still, isolated “air-mass” cells can punch through along the Soutpansberg ridge where extra surface heating nibbles the lid away. Citrus growers around Tzaneen watch the dew-point depression the way punters study tote boards; a gap above 11 °C tells them the atmosphere can still guzzle irrigation water and brew late-day popcorn storms.
These micro-storms are capricious. A 5 km-wide cell can drop 25 mm on one farm while its neighbour’s sprinklers run dry. Letaba farmers therefore stagger irrigation shifts, keeping a pivot parked for a possible 30-minute cloudburst. Over the past decade soil-moisture probes and cheap SMS alerts have cut water use by 12 % – proof that meteorological cat-and-mouse can be profitable.
North West & Free State: Dry-Line Theatre and Gust-Front Ballet
A faint surface trough – visible on infrared as a 3 °C thermal stripe – runs from Upington to Welkom. East of the line dew-points balloon to 18 °C; west they collapse below 8 °C. Meteorologists call this invisible boundary the dry line, Highveld’s favourite storm trigger. Maize fields around Bokone Bophirima sit exactly astride the overlap, so forecasters hedge with “isolated to scattered.” Expect gust fronts near 17:00 racing outward at 50 km/h, hoisting dust that paints sunset the colour of a copper coin.
For storm chasers this is prime time. The first gust front often arrives as a rolling, boiling arc thousands of metres high. Photographers position themselves on the western side, back to the sun, hoping for a back-lit Haboob shot. But the same gust can snap a hundred pivot irrigators like match-sticks. Farmers have learned to park booms parallel to the expected wind, a simple tweak that saves millions in bent aluminium.
Northern Cape: Fire Index Wins the Headlines
On the Ghaap Plateau, Dikgatlong and Phokwane municipalities bake under 14 hours of mid-summer sun. The SAWS Fire Danger Index fuses temperature, humidity, wind and fuel load into one raw number; today it reaches 78, a whisker from the “extreme” cliff of 80. Volunteer wild-fire crews have pre-positioned Category-A grass-fire units on 4×4 tankers. Ironically, the same upper-level ridge suppressing storms here is siphoning that air toward the Highveld, sharpening the thermal contrast that will later feed lightning shows 800 km east.
Tourists chasing Kalahari lions rarely notice the index, but rental-car companies do. Contracts fine-print forbids off-road driving once FDI hits 75 – tyres on dry grass can ignite a veld fire faster than a discarded cigarette. Lodge managers keep slip-on fire blankets and 20-l backpack sprayers ready; the cost of being wrong is a scorched concession and national TV outrage.
Coastal Microclimates: From Icy Upwelling to Steamy Estuaries
Western Cape: Two Oceans, Three Forecast Rooms
While the rest of the country counts lightning, the Cape answers to a 1032 hPa South-Atlantic High. It flings a filament of marine air past Cape Agulhas; coastal upwelling drags sea-surface temperatures to 14 °C, so the breeze becomes a natural air-conditioner. Expect 24 °C in Paarl but only 16 °C in Hermanus, 90 km apart. UV rockets to index 11, thanks to thin mid-summer ozone plus reflective fynbos scrub – dermatologists prescribe zinc oxide even for a 30-minute trail run.
Surfers read the chill differently. The cold, nutrient-rich water draws sardines and, behind them, Bryde’s whales. A 2 mm neoprene vest is useless; you need a 4/3 full suit and a respectful distance from the dark fins gliding through the line-up. Meanwhile wine-growers toast the cool nights: slower ripening traps aroma compounds, promising another award-winning vintage.
Eastern Cape: A Split Personality Province
The Great Fish River splits the province meteorologically. West of the river, ridges fade into semi-desert; east of it, the Amatola and Tsitsikamma ranges wring 800 mm of rain annually. A weak coastal low meanders toward Port Alfred today, nudging stratiform drizzle below 2 km onto the Garden Route. North of Graaff-Reinet only high-based virga evaporates before touchdown. Wind flips from moderate south-easterly to fresh easterly after lunch – the inland heat-low over the Karoo is deepening, acting like a giant piston that pumps air toward the interior.
Road-trippers notice the shift at the toll gate: one minute you’re wiping sea-spray off the windshield, the next you’re inhaling dry Karoo dust. Pack both a rain jacket and lip balm; the province is famous for delivering all four seasons before you finish your coffee.
KwaZulu-Natal: Hot Land, Cold Sea, Explosive Gradient
The Agulhas Current slides south at 26 °C, yet a 40 km strip of inshore marine air keeps beaches in the low-20s. Drive 30 km inland and the mercury leaps 8 °C. That clash is a sea-breeze engine; by 14:00 a 25-kt southerly blasts through Durban harbour, forcing container cranes to suspend high-stack lifts. Storms piggy-back the breeze front, and the Drakensberg’s 1:20 slope converts 10 mm coastal showers into 60 mm deluges over Himeville. Farmers above 1 200 m have already herded livestock to higher camps.
Beach lifeguards love the sea-breeze because it blows rafts of bluebottle jellyfish offshore, but surfers hate the on-shore chop that turns perfect point breaks into salad. Everyone agrees on one thing: when the wind backs suddenly south-west, a late-afternoon lightning barrage is likely. Head for the clubhouse, not the crest.
Hidden Hazards: UV, Lightning and the Data We Still Miss
UVB: The Invisible Summer Tax
Southern Africa receives 20–30 % more ultraviolet than comparable northern latitudes. Three culprits share the blame: lingering ozone-hole thinning, Earth’s 3 % perihelion proximity during austral summer, and cleaner maritime air that scatters fewer rays. The SAWS Global Solar UV Index peaks at 11 along the coast and 9 on the Highveld today. An unprotected fair skin burns in 18 min at index 9; SPF-30 can theoretically stretch that to 270 min, but only if you slap on a shot-glass worth – most folk use half, cutting true protection to roughly SPF-5.5. Re-apply every two hours and remember UVA sneaks through car windows – you’re not safe in traffic.
Tinted windows help, yet South African law limits windscreen film to 35 % visible-light transmission. Dermatologists lobby for clear UVA-filtering films instead, arguing that commuters accumulate more left-side sun damage in a year than a holidaymaker on an Italian beach. Until legislation catches up, long-sleeve shirts and mineral sunscreen remain the smartest daily commute accessory.
Lightning Hacks That Outrun the Bolt
Forget the old “lie flat” myth; ground current kills. Use the 30-30 rule – if thunder arrives within 30 seconds of a flash, you are inside the 10 km danger disc; shelter indoors and wait 30 minutes after the last rumble. A car works: the metal skin forms a Faraday cage, but close the windows and avoid touching the steering column mid-strike. Avoid plumbing: copper pipes conduct earth current, and showering during a storm accounts for ~12 % of indoor lightning injuries worldwide. If caught in the open, crouch low with feet together, minimising the pathway across your heart.
Campers add a twist: sit on a sleeping mat, not the ground, and keep boots on. A 5 mm layer of rubber can drop current through the torso by an order of magnitude – cheap insurance when a Drakensberg storm arrives faster than you can pack a tent.
Radar Blind Spots and Cell-Phone Rain Gauges
South Africa’s 14 S-band Doppler radars update every six minutes, yet the Drakensberg blocks beams, creating a data void over northern Lesotho – precisely where the Orange River begins. SAEON scientists now harvest rainfall data from commercial 15 GHz microwave links between Vodacom towers. Raindrops attenuate the signal; measuring power drop between masts reconstructs rainfall down to one-minute steps. Early trials correlate at 0.85 with radar data, turning private telecom networks into a citizen-science grid. If the method scales, insurance firms could price crop cover per township, not province.
The same principle works in cities, where tall buildings create micro-urban “mountains.” Researchers predict that combining link data with vehicle wiper sensors may one day deliver street-level rainfall maps in real time – Google Maps for puddles, delivered at the speed of a WhatsApp download.
Climate Change Footnote Hidden in Today’s Chart
The 850 hPa temperature anomaly is +2.3 °C above the 1981-2010 mean. That nudges the freezing line 400 m higher, melting hail embryos before they fatten. Since 1998 SAWS observes more storms yet smaller hailstones; meanwhile Claus
[{“question”: “What does a Level-2 yellow thunderstorm alert mean in South Africa?”, “answer”: “A Level-2 yellow thunderstorm alert, issued by the South African Weather Service (SAWS), indicates a moderate chance of significant disruption due to severe weather. This includes frequent lightning strikes (every half-minute within the warning area), heavy rainfall (up to 30 mm/hour), damaging hail (large enough to cause dents), and runoff that can overwhelm typical drainage systems. Emergency services move from monitoring to preparing, and public awareness is crucial as outdoor activities may be cancelled and insurance excesses for hail claims can increase.”}, {“question”: “What four air masses influence South Africa’s weather?”, “answer”: “South Africa’s dynamic weather patterns are a result of the collision of four distinct air masses: warm, moist air streams from the Mozambique Channel; cold polar maritime air masses from the Southern Ocean; hot, dry subsiding air anchored by the Kalahari High; and searing berg-wind currents that descend from the Great Escarpment. This interaction creates a diverse range of conditions across the country.”}, {“question”: “Why is Gauteng a ‘lightning laboratory’?”, “answer”: “Gauteng’s high elevation (1,400m to 1,700m) thins the air, allowing ice crystals to persist at very low temperatures for longer, leading to more frequent collisions and charge separation. This results in 20-30 cloud-to-ground flashes per square kilometer annually, making it a global hotspot for lightning. Additionally, urban heat islands over central Johannesburg add extra convective available potential energy (CAPE), further intensifying storm development, and numerous metallic rooftops act as perfect grounding points, increasing the risk of lightning strikes.”}, {“question”: “How does the Drakensberg Escarpment influence storms in Mpumalanga?”, “answer”: “The Drakensberg and Lebombo escarpments act as a physical barrier, forcing moist low-level air upwards at speeds of 1-2 meters per second. This uplift mechanism promotes the rapid development of cumulonimbus clouds and intense thunderstorms. The region also experiences morning fog due to high dew points, which, once dissipated by thermals, fuels the growth of new storm cells from a deep boundary layer.”}, {“question”: “What is the ‘dry line’ and how does it affect weather in North West and Free State?”, “answer”: “The ‘dry line’ is an invisible atmospheric boundary, often seen on infrared imagery as a thermal stripe, where there’s a sharp contrast in moisture. East of this line, dew points are high (e.g., 18°C), while to the west, they are significantly lower (below 8°C). This boundary is a key trigger for storm development in the Highveld. As moist air from the east overrides drier air to the west, it creates instability, leading to the formation of thunderstorms, often accompanied by strong gust fronts that can kick up significant dust.”}, {“question”: “How does climate change impact severe weather in South Africa?”, “answer”: “Climate change is intensifying severe weather events in South Africa. The information provided mentions that the 850 hPa temperature anomaly is +2.3°C above the 1981-2010 mean, which raises the freezing line by 400m. This higher freezing line can cause hail embryos to melt before they grow large, leading to more storms but potentially smaller hailstones. This highlights the increased importance of accurate data and public awareness in adapting to these changing weather patterns.”}]